
Office
We look for mispricing between asking yields and comparable transactions, adjusted for lease profile and building quality.
What we score: Yield vs comparables · WAULT · Tenant covenant · EPC rating and capex exposure
Risks we flag: Vacancy, obsolescence, refurbishment costs


Industrial Warehouse
We focus on assets where passing rent sits below market, creating reversion potential.
What we score: Rent vs ERV · Site coverage · Eaves height and access · Occupier demand
Risks we flag: Single-tenant dependency, environmental contamination
Land
We target assets where yield spread is wide relative to tenant strength and location fundamentals.
What we score: Yield spread · Covenant strength · Footfall trends · Rent affordability
Risks we flag: Structural decline, over-rented units, tenant failure
Retail
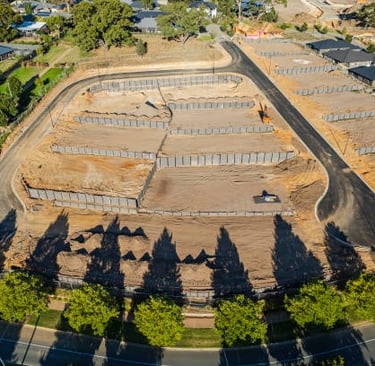
We assess development land on what can realistically be built and what it will be worth on completion.
What we score: Planning status · Residual land value · Build cost assumptions · Exit pricing
Risks we flag: Planning risk, cost inflation, delivery delays



Student Accommodation
We score purpose-built student housing on demand depth and operational quality.
What we score: Bed-to-student ratio · University proximity · Occupancy history · Operator quality
Risks we flag: Oversupply, policy changes, dependence on international students


Hotels
We evaluate hotels on trading performance and the strength of the operating structure.
What we score: RevPAR and occupancy · Lease vs management agreement · Operator strength · Capex requirements
Risks we flag: Trading volatility, brand dependency, refurbishment cycles



Logistics
We screen last-mile and big-box logistics for rental growth backed by supply constraints.
What we score: Rental growth · Supply pipeline · Transport connectivity · Lease length
Risks we flag: New supply, power availability, tenant concentration


Build to Rent
We evaluate data centres primarily on power and tenant quality.
What we score: Power capacity and grid access · Tenant covenant · Lease length · Connectivity
Risks we flag: Power constraints, technology obsolescence, high capex



Data Center
We assess BTR schemes on sustainable income, not headline rents.
What we score: Rent-to-income ratio · Occupancy and churn · Operating cost ratio · Amenity quality
Risks we flag: Rent regulation, high operating costs, local competition
Nine sectors. One scoring framework.
Every asset is scored on value, yield and risk using the same transparent method, so opportunities across sectors can be compared like for like.
FAQs
Which sectors does AI CoVal cover?
Office, industrial, retail, land, student accommodation, hotels, logistics, build to rent and data centres.
How is each asset scored?
Every asset gets a score for value, yield and risk, using sector-specific metrics in one consistent framework.
Can I compare assets across sectors?
Yes. The same scoring method applies to every sector, so an office and a logistics asset can be compared directly.
Are the assets on this page for sale?
No. They are illustrative examples. Live opportunities are shared with waitlist members.
Who reviews the results?
Our team of real estate professionals reviews every output before it reaches you.
How do I get access?
Join the waitlist, and we will contact you about early access.
Get in touch for early access
Get in touch for early access
AI CoVal © 2026. All rights reserved.
Not financial advice. Do your own due diligence.

